Swing Trading 101: Strategies Every Trader Should Use

Swing trading is a strategy used by traders to take advantage of short- to medium-term price changes in the financial markets.
The main goal of swing traders is to catch “swings” in the market—these are the ups and downs in prices that happen within a current trend. They try to time their trades to enter the market at the best possible moment. Various factors like economic reports, news events, or changes in market sentiment can trigger these price swings. Swing traders rely on technical analysis to figure out the best time to buy or sell.
While many swing traders follow the trend, some choose to trade against it. These traders, known as counter-trend traders, look to profit from market reversals instead of moving in the direction of the current trend.
Swing trading is considered a medium-term strategy because traders typically hold their positions for several days to a few weeks. This approach falls somewhere between day trading, where trades are completed within a single day, and trend or position trading, where positions are held for longer periods.
Swing trading is prevalent among stock and forex traders because these markets usually have enough price movement and trading activity to create opportunities. However, the strategy can also be applied to other assets like commodities, indices, and ETFs.
Is Swing Trading Right for You?
With many trading strategies out there, you might be asking if swing trading is a good fit for you. Here’s what you should consider before choosing this strategy and its benefits.
Swing trading means holding onto trades longer than day trading, so it’s a great option if you can’t watch the markets all day. But it does require patience since trades can stay open for a few days or even weeks. As a swing trader, you’ll need to keep your cool even if prices move against you for a bit.
This strategy works with different types of assets, like stocks, currencies, commodities, and ETFs. This lets you spread out your investments, which can lower your overall risk. However, be careful not to trade too much or hold too many positions at once, as this can lead to higher fees.
Swing trading is also a good choice for beginners because it’s less stressful and demanding than strategies that require quick decisions and constant monitoring.
In the end, finding the best strategy for you might take some experimenting. You may need to try out different methods or even mix strategies to reach your trading goals.
4 Swing Trading Strategies Every Trader Should Use
- Support and Resistance Strategy
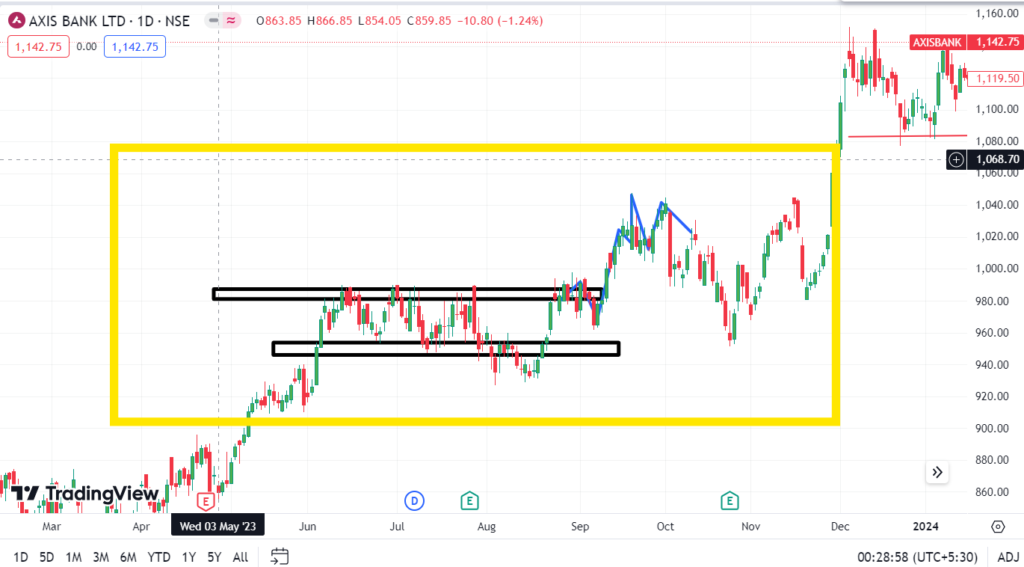
Support and resistance levels are key concepts in swing trading, helping traders identify potential entry and exit points in the market.
- Support is the price level where an asset tends to stop falling and might start to rise again. It’s like a “floor” that holds the price up.
- Resistance is the opposite, acting like a “ceiling” that the price struggles to break above. When the price reaches this level, it often starts to drop.
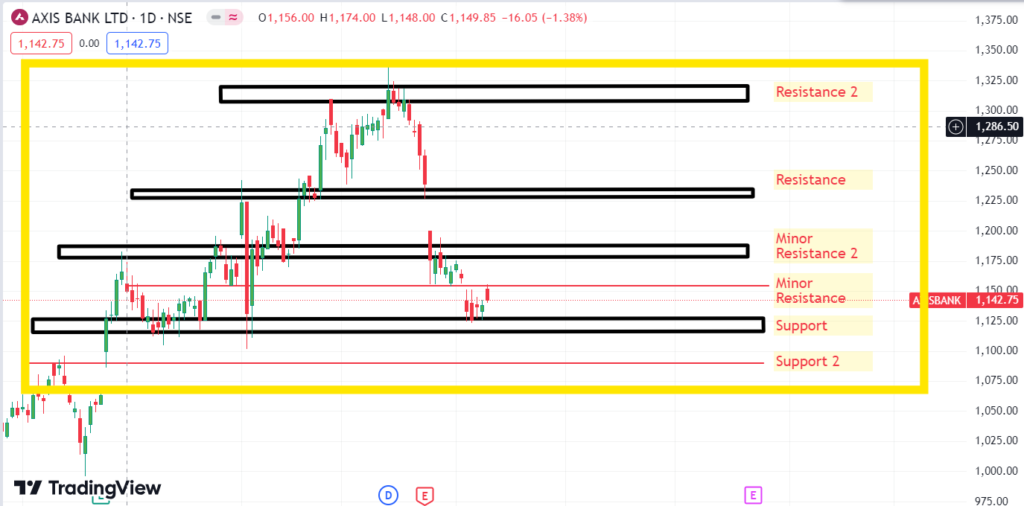
AXIS BANK LTD (1 Day Candlestick chart)
In swing trading, these levels are crucial for making decisions.
- Buying at Support: When the price approaches a support level, traders might look for signs that it’s about to bounce back up. If they believe the price will rise, they enter a buy position near the support level.
- Selling at Resistance: When the price nears a resistance level, traders might expect it to drop. They may sell their position or even enter a short trade near this level.
Sometimes, if the price breaks through support or resistance, it can signal a strong move in that direction. For example, if the price falls below support, it might keep dropping. If it breaks above resistance, it could continue rising.
By understanding and using support and resistance levels, swing traders can make more informed decisions, aiming to enter and exit trades at the most opportune times.
2. 20-Day and 50-Day Moving Averages Strategy
One of the most popular and effective swing trading strategies involves using moving averages to identify trade opportunities. Moving averages help smooth out price data, making it easier to spot trends and potential entry or exit points. Here’s a strategy using a combination of the 20-day and 50-day moving averages.
The Setup: 20-Day and 50-Day Moving Averages
- 20-Day Moving Average (Short-Term Trend): This moving average tracks the average closing price over the last 20 trading days. It gives you a sense of the short-term trend in the market.
- 50-Day Moving Average (Medium-Term Trend): This one tracks the average closing price over the last 50 trading days. It provides insight into the broader trend and helps confirm the direction.
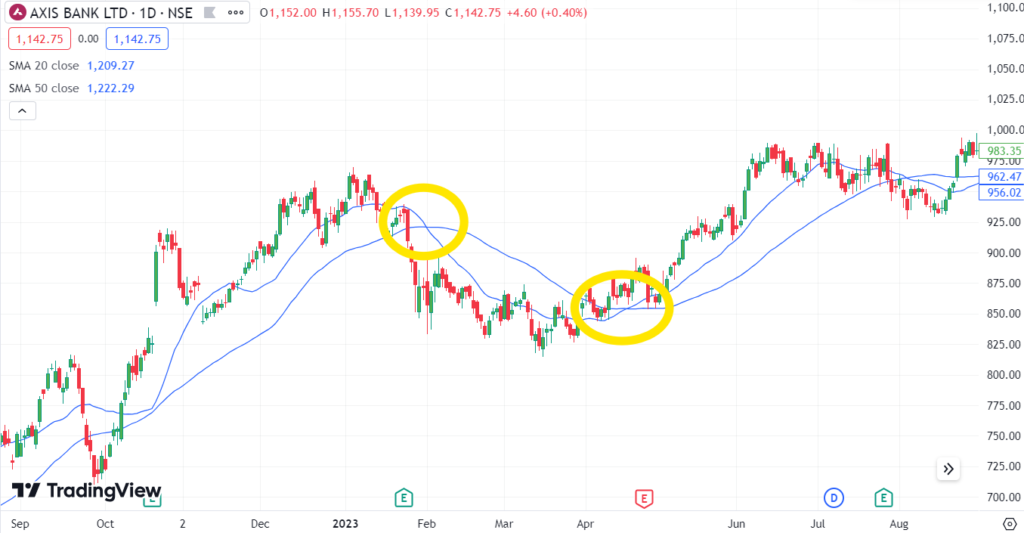
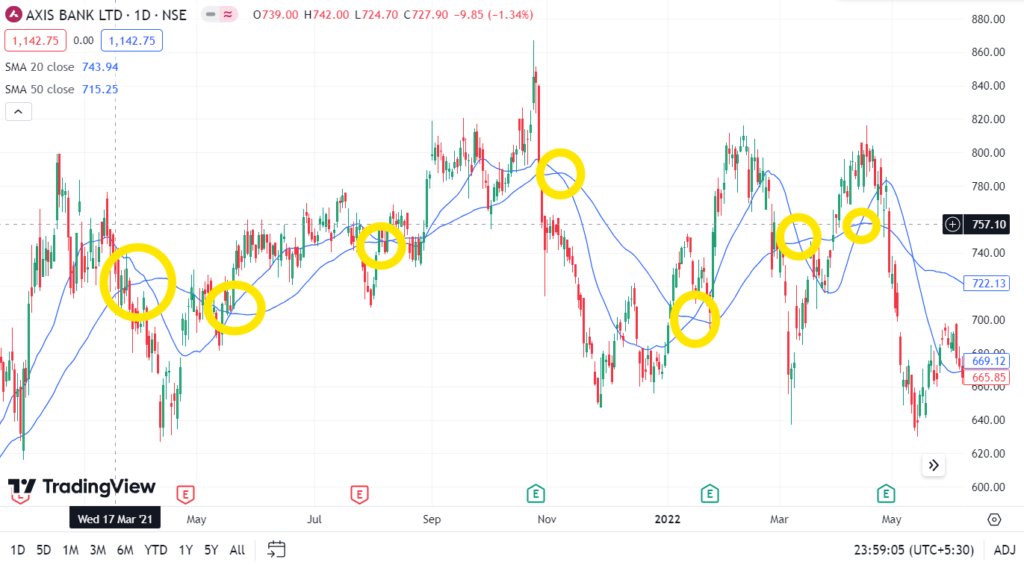
AXIS BANK LTD (1 Day Candlestick chart)
How the Strategy Works
- Identify the Trend:
- When the 20-day moving average crosses above the 50-day moving average, it indicates a potential upward trend. This is known as a “golden cross” and suggests it might be a good time to consider entering a buy position.
- Conversely, when the 20-day moving average crosses below the 50-day moving average, it indicates a potential downward trend. This is called a “death cross” and could signal an opportunity to enter a short position or sell your holdings.
- Entering a Trade:
- Buy Signal: Enter a buy position when the 20-day MA crosses above the 50-day MA, especially if the price is also above both moving averages. This suggests strong bullish momentum.
- Sell Signal: Consider selling or shorting when the 20-day MA crosses below the 50-day MA, particularly if the price is also below both moving averages, indicating bearish momentum.
- Setting a Stop-Loss:
- To manage risk, set a stop-loss slightly below the 50-day moving average for a buy position. This helps protect against a sudden reversal in the trend.
- Exiting the Trade:
- You can exit the trade when the moving averages cross in the opposite direction, signalling a potential trend reversal. For instance, if you entered a buy position on a golden cross, you might exit when a death cross occurs.
Why This Strategy Works
- Flexibility: The 20-day and 50-day moving averages strike a balance between short-term and medium-term trends, making this strategy adaptable to different market conditions.
- Clear Signals: The crossover signals are easy to identify and act upon, making this strategy suitable even for beginners.
- Risk Management: By using the 50-day MA as a guide for setting stop-losses, you can manage your risk more effectively.
This strategy is most effective in trending markets, where prices are moving steadily in one direction. It’s less effective in sideways markets, where prices move within a tight range. By practising this strategy and adjusting the moving averages to suit your trading style, you can refine it to match your specific goals and risk tolerance.
3. Triangle Breakout Swing Strategy
This strategy focuses on trading price breakouts from triangle chart patterns, which are common indicators of potential price moves. Triangle patterns include ascending triangles, descending triangles, and symmetrical triangles. These patterns represent periods of consolidation before a potential breakout, making them excellent opportunities for swing traders.
How the Triangle Breakout Swing Strategy Works
Identify the Triangle Pattern:
- Ascending Triangle: This pattern forms when the price makes higher lows while the highs remain consistent, creating a triangle shape. It suggests potential upward momentum.
- Descending Triangle: This pattern occurs when the price makes lower highs while the lows remain at a consistent level, indicating potential downward momentum.
- Symmetrical Triangle: This pattern is formed when both the highs and lows converge, indicating a period of consolidation before a breakout in either direction.
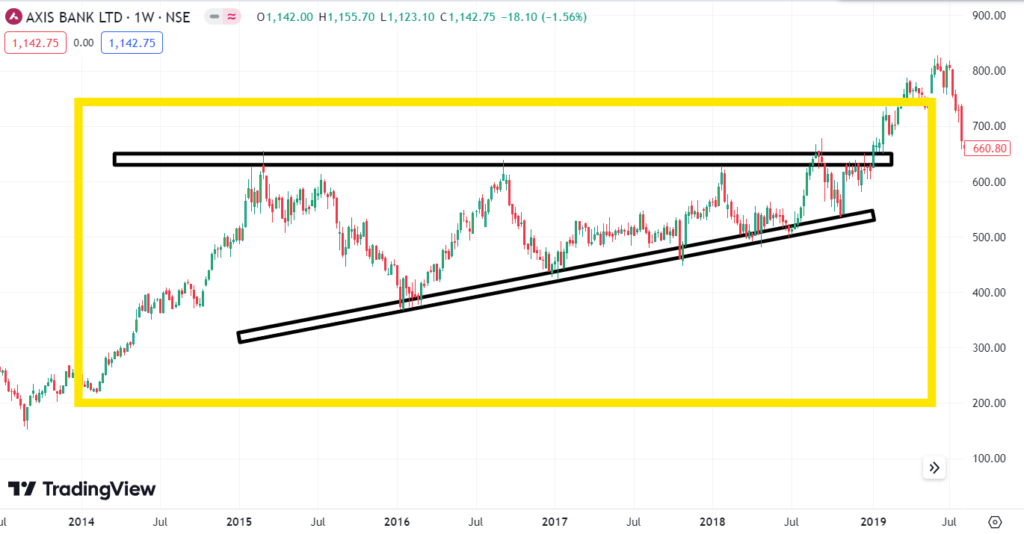
- Wait for the Breakout:
- Upward Breakout (Bullish): In an ascending triangle, wait for the price to break above the resistance line. In a symmetrical triangle, an upward breakout from the converging trendlines signals a potential buy opportunity.
- Downward Breakout (Bearish): In a descending triangle, look for the price to break below the support line. In a symmetrical triangle, a downward breakout signals a potential sell or shorting opportunity.
- Enter the Trade:
- Buy Signal: Enter a buy position immediately after the price breaks above the resistance line in an ascending or symmetrical triangle. Confirm the breakout with strong volume, as this increases the likelihood of a sustained move.
- Sell Signal: Enter a sell or short position after the price breaks below the support line in a descending or symmetrical triangle, again confirming the move with strong volume.
- Set a Stop-Loss:
- Place a stop-loss just below the breakout point for a buy position or just above the breakout point for a sell position. This protects against false breakouts, where the price reverses direction soon after breaking out.
- Set a Profit Target:
- Measure the Height of the Triangle: Measure the distance between the highest and lowest points of the triangle pattern. This distance can be projected from the breakout point to set your profit target.
- Partial Exit: Consider taking partial profits as the price moves in your favour and trailing the stop-loss to lock in gains.
- Manage the Trade:
- If the price continues in the direction of the breakout, consider moving your stop-loss to breakeven or beyond to secure profits. Adjust your target if the momentum is strong.
Why the Triangle Breakout Swing Strategy Works
- Reliable Patterns: Triangle patterns are well-known and widely followed by traders, making the breakout points significant.
- Clear Entry and Exit Points: The breakout from the triangle provides clear signals for entering and exiting trades, making it easier to implement.
- Versatility: This strategy can be applied to various markets, including stocks, forex, and commodities, and is effective across different time frames.
The “Triangle Breakout Swing Strategy” is particularly effective in markets with strong trends or during periods of consolidation that lead to significant price moves. By mastering this strategy, swing traders can take advantage of powerful breakouts with well-defined risk and reward parameters.
4. Momentum Breakout Swing Strategy
The “Momentum Breakout Swing Strategy” is designed to capitalize on strong price movements that occur when an asset breaks through a significant support or resistance level. Breakouts often lead to sharp price movements, making them ideal for swing traders who aim to catch these moves early.
How the Momentum Breakout Swing Strategy Works
Identify Key Support and Resistance Levels:
- Support Level: A price level where the asset has historically had difficulty falling below, as buyers tend to step in, creating a “floor” for the price.
- Resistance Level: A price level where the asset has historically had difficulty moving above, as sellers tend to emerge, creating a “ceiling” for the price.
- Monitor for a Breakout:
- Breakout Above Resistance (Bullish): If the price breaks above a well-established resistance level, it signals a potential upward move. Look for a strong candle that closes above the resistance line.
- Breakout Below Support (Bearish): If the price breaks below a well-established support level, it signals a potential downward move. Watch for a strong candle that closes below the support line.
- Confirm the Breakout:
- Volume Confirmation: A genuine breakout is often accompanied by a spike in trading volume. High volume during the breakout indicates strong market interest and increases the likelihood of the move continuing.
- Retest Confirmation: After a breakout, the price may retest the broken support or resistance level. If the level holds during the retest, it strengthens the validity of the breakout.
- Enter the Trade:
- Buy Signal: Enter a buy position immediately after a confirmed breakout above resistance, especially if supported by high volume or a successful retest.
- Sell Signal: Enter a sell or short position immediately after a confirmed breakout below support, particularly if the breakout is validated by volume or a retest.
- Set a Stop-Loss:
- For a Buy Position: Place a stop-loss just below the resistance level that was broken. This limits your risk if the breakout fails and the price falls back below resistance.
- For a Sell Position: Place a stop-loss just above the support level that was broken. This protects you if the price reverses and moves back above support.
- Set a Profit Target:
- Measure the Breakout Range: Determine the distance between the support and resistance levels before the breakout occurred. This range can be projected from the breakout point to set a profit target.
- Use Trailing Stops: As the price moves in your favour, consider using a trailing stop to lock in profits and allow the trade to run if the momentum continues.
- Manage the Trade:
- If the trade moves in your favour, you can adjust your stop-loss to breakeven or closer to the current price to reduce risk. Consider scaling out of the position as the price approaches the profit target or shows signs of weakening momentum.
Why the Momentum Breakout Swing Strategy Works
- Captures Strong Moves: Breakouts often lead to significant price movements, allowing swing traders to capitalize on the momentum.
- Clear Entry and Exit Points: The strategy provides clear signals based on price levels, making it easier to execute.
- Effective in Trending Markets: This strategy works particularly well in markets with strong trends or after periods of consolidation, where the price is poised for a decisive move.
The “Momentum Breakout Swing Strategy” is a powerful tool for swing traders looking to take advantage of significant price moves following a breakout. By combining key levels, volume analysis, and proper risk management, traders can increase their chances of catching profitable trades.
Conclusion: Swing Trading Strategies for Success
In this discussion, we explored several swing trading strategies that can help you make the most of market movements. We started by covering the basics of swing trading, which is great for traders who want to hold positions for a few days to a few weeks. Then, we dove into specific strategies like the “Triangle Breakout Swing Strategy” and the “Momentum Breakout Swing Strategy.”
Each strategy was explained with simple steps to help you spot opportunities and manage your trades effectively. We talked about using tools like moving averages, chart patterns, and breakouts to identify when to enter and exit trades.
The main point to remember is that combining these strategies with good risk management is key. Whether you’re tracking trends with moving averages or looking for breakouts, these methods work best when you have a clear plan to protect your investments and secure profits.
In conclusion, learning and practising these swing trading strategies can help you become a more successful trader. By staying disciplined and refining your approach over time, you can build a trading plan that fits your goals and helps you achieve consistent results.


