Jindal Steel and Power Ltd.: Market Analysis and Investment Review
Jindal Steel and Power Limited (JSPL) is one of India’s leading companies in the steel and power sector. Founded in 1979, JSPL has grown into a major player with operations spanning steel manufacturing, power generation, and mining. As part of the large and diversified O.P. Jindal Group, which is valued at around $18 billion, JSPL is known for its innovative approach, high-quality products, and significant contributions to the infrastructure and economy of India.
Jindal Steel and Power Limited (JSPL) is a top steel producer in India, known for its integrated operations that cover everything from mining raw materials to producing finished steel products. The company operates several manufacturing plants located in different parts of India:
- Raigarh, Chhattisgarh: This is one of JSPL’s main facilities, producing a variety of steel products.
- Angul, Odisha: A state-of-the-art steel manufacturing unit.
- Barbil, Odisha: Known for pellet production.
- Patratu, Jharkhand: Specializes in producing different types of steel.
JSPL’s production capacities are impressive, with the ability to produce 10.42 million tonnes of iron, 9 million tonnes of pellets, 9.6 million tonnes of liquid steel, and 6.65 million tonnes of finished steel every year. The company’s product range includes TMT bars, plates, coils, beams, columns, rails, angles, channels, wire rods, and more. This wide variety of products helps meet the diverse needs of customers in the construction, infrastructure, and manufacturing sectors.
We will look closely at how Jindal Steel and Power Limited (JSPL) is performing financially. We’ll examine their financial statements, calculate important financial metrics, and use charts and graphs to highlight key trends. After thoroughly analyzing this information, we will recommend whether or not you should buy JSPL’s stock. Be sure to read to the end for our conclusion!
Key Operations and Products
JSPL produces a wide range of steel products, including:
- TMT bars
- Plates
- Coils
- Beams and columns
- Rails
- Angles and channels
- Wire rods
- Fabricated sections
The company also generates electricity from its thermal power plants in Raigarh and Angul, with a combined capacity of about 1,634 megawatts.
Jindal Steel and Power Ltd. – Financial Analysis
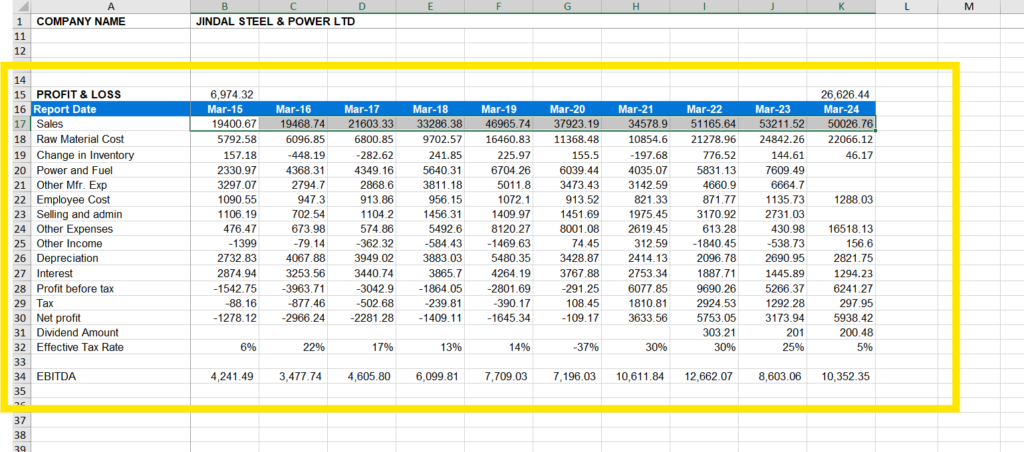
Income Statement – Jindal Steel and Private Limited
Margin Analysis
Let’s look at the financial performance of Jindal Steel and Power Limited (JSPL) from 2015 to March 2024. We will focus on three important profit margins: Gross Margin, EBITDA Margin, and EBIT Margin. Here’s a simple breakdown of these margins along with their averages over the years.
Gross Margin
Gross Margin shows how much profit JSPL makes after subtracting the cost of making its products.
- Average Gross Margin: 37.47%
- Analysis: The Gross Margin has changed a lot, from a low of 24.63% in 2022 to a high of 53.41% in 2024. Overall, it has been increasing recently, which means JSPL is getting better at managing its costs or increasing its sales.
EBITDA Margin
EBITDA Margin tells us about JSPL’s core profit, before accounting for interest, taxes, and depreciation.
- Average EBITDA Margin: 22.66%
- Analysis: The EBITDA Margin has also varied, reaching a high of 31.62% in 2020 and a low of 17.65% in 2016. Despite these changes, it shows that JSPL has kept a reasonable level of basic operational profit over the years.
EBIT Margin
EBIT Margin shows JSPL’s profit after subtracting operating expenses but before interest and taxes.
- Average EBIT Margin: 11.13%
- Analysis: The EBIT Margin has been the most unpredictable, with a negative margin of -3.24% in 2016 and a high of 26.23% in 2021. Recent years have seen positive growth, indicating better control over operating costs and higher profits.
Summary
- Average Gross Margin: 37.47%
- Average EBITDA Margin: 22.66%
- Average EBIT Margin: 11.13%
Overall, JSPL’s profit margins suggest that the company has improved its efficiency and cost management in recent years, leading to better financial performance. This positive trend is a good sign for the company’s future.
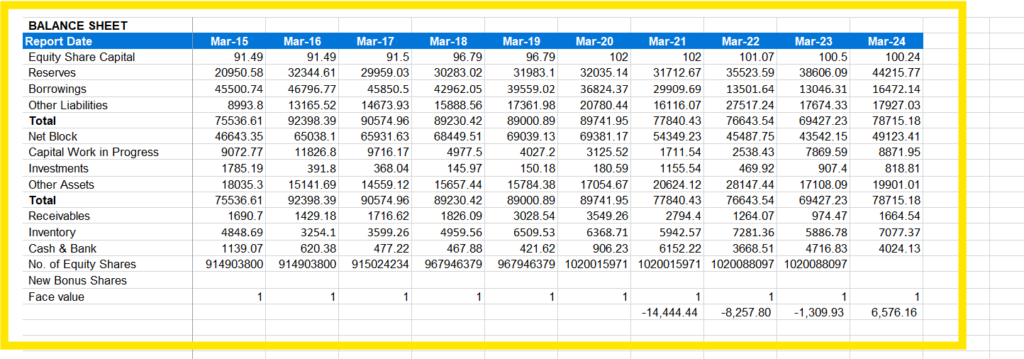
Balance Sheet – Jindal Steel and Private Limited
Efficiency Metrics
We’ll review JSPL’s efficiency in managing its receivables, payables, inventory, fixed assets, and capital using turnover ratios from 2015 to March 2024. Here’s a simplified analysis along with the average values for each ratio.
Debtor Turnover Ratio
The Debtor Turnover Ratio indicates how efficiently JSPL collects its receivables from customers.
- Average Debtor Turnover Ratio: 22.00x
- Analysis: The ratio has increased significantly, reaching a high of 54.61x in 2023. This indicates that JSPL has become much more efficient in collecting payments from its customers over the years.
Creditor Turnover Ratio
The creditor Turnover Ratio shows how quickly JSPL pays its suppliers.
- Average Creditor Turnover Ratio: 2.15x
- Analysis: The ratio fluctuates moderately, with a peak of 3.01x in 2023. A higher ratio suggests JSPL is paying its suppliers more quickly, which could be a sign of strong financial health.
Inventory Turnover Ratio
Inventory Turnover Ratio measures how efficiently JSPL manages its inventory.
- Average Inventory Turnover Ratio: 6.28x
- Analysis: The ratio has been rising, peaking at 9.04x in 2023. This indicates that JSPL has become better at managing its inventory, selling goods more quickly and reducing holding costs.
Fixed Asset Turnover Ratio
Fixed Asset Turnover Ratio indicates how efficiently JSPL uses its fixed assets to generate sales.
- Average Fixed Asset Turnover Ratio: 0.67x
- Analysis: The ratio shows improvement, with a high of 1.22x in 2023. This means JSPL has become more efficient in using its fixed assets to generate revenue.
Capital Turnover Ratio
Capital Turnover Ratio measures how efficiently JSPL uses its capital to generate revenue.
- Average Capital Turnover Ratio: 1.10x
- Analysis: The ratio has improved, peaking at 1.46x in 2019. This suggests that JSPL is effectively utilizing its capital to generate sales.
Summary
- Average Debtor Turnover Ratio: 22.00x
- Average Creditor Turnover Ratio: 2.15x
- Average Inventory Turnover Ratio: 6.28x
- Average Fixed Asset Turnover Ratio: 0.67x
- Average Capital Turnover Ratio: 1.10x
Overall, the turnover ratios suggest that JSPL has improved its efficiency in collecting receivables, managing inventory, utilizing fixed assets, and using capital over the years. This positive trend indicates a more streamlined and effective operation, which is beneficial for the company’s financial health and sustainability.
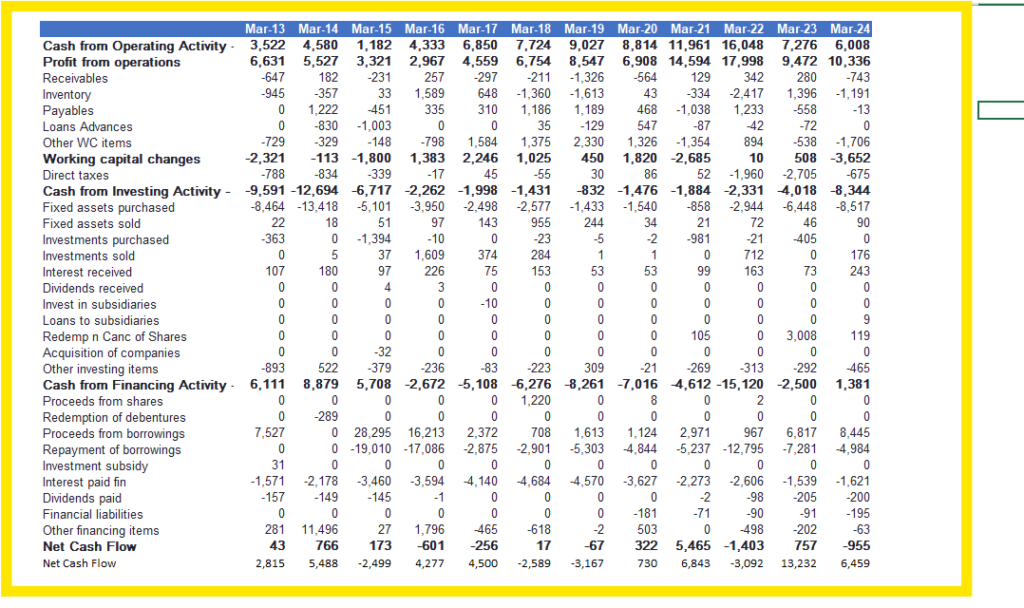
Cashflow Statement – Jindal Steel and Private Limited
These ratios provide insights into Jindal Steel and Power Limited’s (JSPL) cash flow management efficiency over the past decade:
- CFO/Sales Ratio:
- This ratio indicates how much cash flow from operations (CFO) the company generates for every rupee of sales.
- JSPL’s CFO/Sales ratio has varied significantly over the years, ranging from 46% to 201%.
- Higher ratios (e.g., 186% and 201%) suggest that JSPL has been effective in converting its sales into cash flow from operations during those years.
- However, there is variability, with lower ratios (e.g., 46% to 88%) indicating periods where the company may have faced challenges in generating cash flow relative to sales.
- CFO/Total Assets Ratio:
- This ratio measures the efficiency of cash flow generation relative to the total assets employed by the company.
- JSPL’s CFO/Total Assets ratio has ranged from 30% to 48%.
- A higher ratio (e.g., 48%) indicates that JSPL has been able to generate significant cash flow from its total asset base during certain years.
- The consistency of this ratio around the 30% to 40% range in most years suggests moderate efficiency in utilizing total assets to generate cash flow.
- CFO/Total Debt Ratio:
- This ratio evaluates the company’s ability to generate cash flow from operations to cover its total debt obligations.
- JSPL’s CFO/Total Debt ratio has shown variability, ranging from 54% to 239%.
- Higher ratios (e.g., 173% and 239%) indicate a stronger ability to generate sufficient cash flow from operations to cover its total debt in those years.
- However, the lower ratios (e.g., 54% to 96%) suggest periods where JSPL may have faced challenges in generating adequate cash flow relative to its total debt burden.
Analysis:
- Strengths: JSPL has demonstrated periods of strong cash flow generation relative to sales, assets, and debt, especially during years with higher ratios.
- Challenges: Variability in ratios indicates that JSPL’s cash flow generation has not been consistently robust across all years, potentially reflecting operational or economic challenges during certain periods.
Jindal Steel and Power Ltd. – Technical Analysis
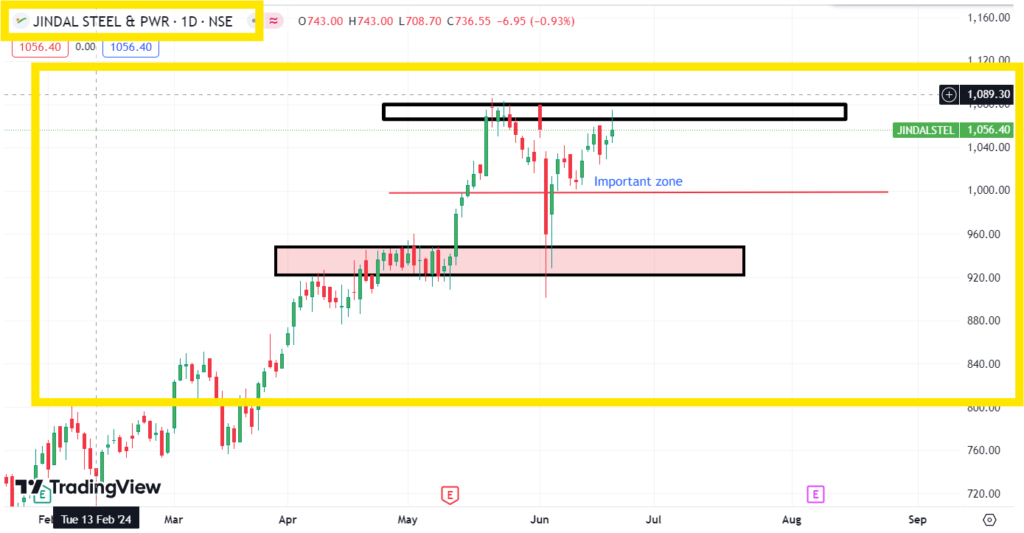
Jindal Steel and Power Limited (1-Day Chart)
After analyzing Jindal Steel and Power Limited’s stock (JSPL), here are some key insights:
- Bullish Rally Potential: For JSPL to see a significant upward movement, it needs to break through the price range of Rs. 1070 to Rs. 1080. This breakout could attract a lot of buyers (bulls), potentially driving the stock price higher.
- Critical Support Level: There’s a crucial support level of around Rs. 1000. If JSPL’s stock price drops below this level and stays there for a while, it might indicate a lack of buyer confidence. However, if it briefly dips below Rs. 1000 and then rebounds quickly, it could mean there are enough buyers interested in the stock at that price.
- Entry Strategy: If you’re considering buying JSPL’s stock, one strategy is to wait for it to confidently surpass Rs. 1080. This would suggest that the momentum is strong enough to continue pushing the price upwards. On the other hand, if the stock temporarily drops below Rs. 1000 but doesn’t stay there long, it might be a good opportunity to buy, anticipating a bounce back towards the Rs. 1070 to Rs. 1080 range.
This approach provides clear guidance on when to consider buying JSPL’s stock based on its recent price movements and potential market sentiment shifts.
Jindal Steel and Power Ltd. – Competitor Analysis
To begin a comprehensive competitor analysis, it’s essential to identify the main competitors of JSPL in both the steel and power sectors. Here’s a list of key competitors:
Steel Sector Competitors
- Tata Steel
- One of the largest steel manufacturers in India.
- Known for its integrated operations and strong global presence.
- Steel Authority of India Limited (SAIL)
- A government-owned entity and one of the largest steel producers in India.
- Extensive product range and large production capacity.
- JSW Steel
- A leading private sector steel manufacturer in India.
- Strong focus on innovation and technological advancements.
- ArcelorMittal
- The world’s largest steel producer with operations in more than 60 countries.
- Significant presence in the Indian market through joint ventures and acquisitions.
Tata Steel
Profitability Margins:
- Gross Margin: 25.24% – 44.83%
- EBITDA Margin: -0.61% – 26.02%
- EBIT Margin: -5.82% – 22.29%
Returns:
- ROCE: -4.72% – 28.63%
- Retained Earnings: 0.00% – 84.60%
- ROE: -8.88% – 21.29%
Efficiency Ratios:
- Debtor Turnover: 8.45x – 36.59x
- Creditor Turnover: 1.99x – 2.96x
- Inventory Turnover: 4.35x – 5.55x
- Fixed Asset Turnover: 1.04x – 2.05x
- Capital Turnover: 1.90x – 4.45x
Steel Authority of India Limited (SAIL)
Profitability Margins:
- Gross Margin: 18.18% – 37.25%
- EBITDA Margin: -7.31% – 20.65%
- EBIT Margin: -13.50% – 16.51%
Returns:
- Return on Capital Employed (ROCE): -6.96% – 23.90%
- Retained Earnings: 0.00% – 100.00%
- Return on Equity (ROE): -6.11% – 15.86%
Efficiency Ratios:
- Debtor Turnover: 6.97x – 21.69x
- Creditor Turnover: 1.48x – 2.31x
- Inventory Turnover: 2.52x – 5.22x
- Fixed Asset Turnover: 0.84x – 1.45x
- Capital Turnover: 0.97x – 1.91x
ArcelorMittal
Profitability Margins:
- Gross Margin: 8.49% – 20.46%
- EBITDA Margin: -13.51% – 13.26%
- EBIT Margin: -20.98% – 5.79%
Returns:
- Return on Capital Employed (ROCE): -19.72% – 2.35%
- Retained Earnings: 0.00% consistently
- Return on Equity (ROE): -64.01% – -1.31%
Efficiency Ratios:
- Debtor Turnover: 9.65x – 27.60x
- Creditor Turnover: 0.65x – 2.32x
- Inventory Turnover: 2.36x – 7.74x
- Fixed Asset Turnover: 0.32x – 1.20x
- Capital Turnover: -1.53x – 46.36x
JSW Steel
Profitability Margins:
- Gross Margin: 15.08% – 36.35%
- EBITDA Margin: 11.13% – 26.72%
- EBIT Margin: 6.63% – 22.62%
Returns:
- Return on Capital Employed (ROCE): 5.07% – 23.74%
- Retained Earnings: 60.30% – 100.00%
- Return on Equity (ROE): 1.76% – 13.86%
Efficiency Ratios:
- Debtor Turnover: 11.84x – 23.26x
- Creditor Turnover: 2.00x – 2.90x
- Inventory Turnover: 4.33x – 5.83x
- Fixed Asset Turnover: 0.74x – 1.59x
- Capital Turnover: 1.71x – 2.57x
Here’s a comparative analysis of Jindal Steel and Power Limited (JSPL) with Tata Steel, JSW Steel, SAIL, and ArcelorMittal based on key financial metrics:
Gross Margin:
- JSPL: Ranges from 17.92% to 36.35%, showing variability but competitive margins.
- Tata Steel: Ranges from 14.26% to 37.25%, with similar variability.
- JSW Steel: Consistently higher, ranging from 20.79% to 27.02%.
- SAIL: Ranges from 12.04% to 25.78%.
- ArcelorMittal: Ranges from 8.49% to 28.30%, with significant variability.
EBITDA Margin:
- JSPL: Ranges from -7.27% to 26.72%, indicating fluctuating profitability.
- Tata Steel: Ranges from -13.51% to 22.33%, showing wider fluctuations.
- JSW Steel: More stable, ranging from 10.10% to 22.33%.
- SAIL: Ranges from -20.98% to 10.10%, with negative margins at times.
- ArcelorMittal: Ranges from 2.30% to 16.64%.
Return on Equity (ROE):
- JSPL: Ranges from -1.31% to 15.86%, indicating mixed performance.
- Tata Steel: Ranges from -8.88% to 21.29%, also showing mixed results.
- JSW Steel: More stable, with ROE ranging from 1.92% to 8.92%.
- SAIL: Ranges from -14.23% to 3.37%, with more negative performance.
- ArcelorMittal: Ranges from -10.59% to 2.57%.
Debtor Turnover Ratio:
- JSPL: Ranges from 10.92x to 27.60x, indicating effective management of debtors.
- Tata Steel: Ranges from 8.45x to 36.59x, showing similar efficiency.
- JSW Steel: Ranges from 6.97x to 17.73x, slightly lower turnover.
- SAIL: Ranges from 9.65x to 27.60x, similar to JSPL.
- ArcelorMittal: Ranges from 10.92x to 23.89x.
Inventory Turnover:
- JSPL: Ranges from 2.36x to 7.74x, indicating moderate efficiency.
- Tata Steel: Ranges from 2.52x to 5.83x, showing slightly lower turnover.
- JSW Steel: Ranges from 4.50x to 7.21x, indicating higher turnover.
- SAIL: Ranges from 2.56x to 5.18x.
- ArcelorMittal: Ranges from 2.36x to 5.87x.
Fixed Asset Turnover:
- JSPL: Ranges from 0.33x to 1.47x, showing variability in asset utilization.
- Tata Steel: Ranges from 0.74x to 1.35x, indicating lower turnover.
- JSW Steel: Ranges from 0.89x to 1.35x, similar to Tata Steel.
- SAIL: Ranges from 0.32x to 1.23x.
- ArcelorMittal: Ranges from 0.47x to 1.59x.
Jindal Steel and Power (JSPL) compares favourably with Tata Steel, SAIL, JSW Steel, and ArcelorMittal in terms of gross margins and managing debtors efficiently. However, its profitability metrics like EBITDA margin and return on equity (ROE) vary more, indicating some financial volatility. JSW Steel stands out with steadier financial performance and higher profitability. Investors should weigh these factors along with market conditions before making investment decisions.
Market Share
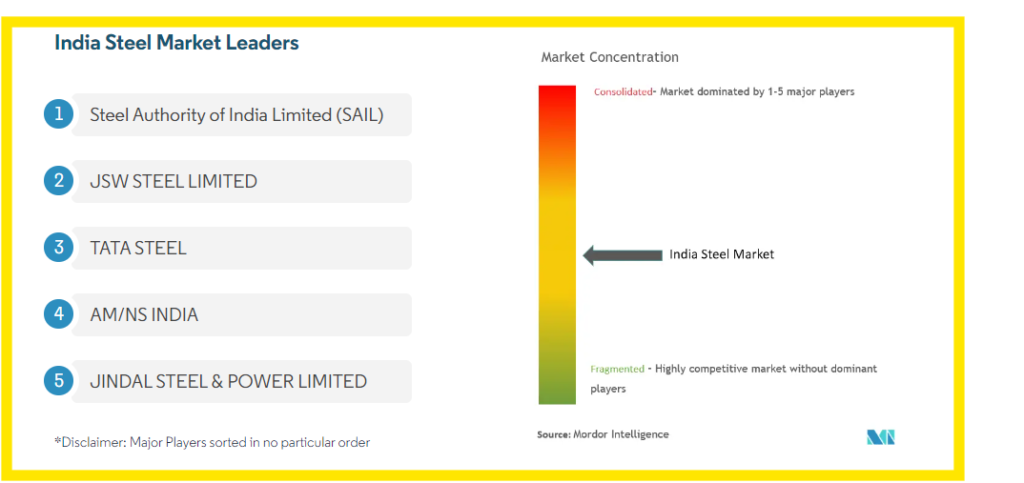
The Indian steel market is partially fragmented. Major players in the industry include:
- JSW Steel Limited
- Tata Steel
- Steel Authority of India Limited (SAIL)
- AM/NS India
- Jindal Steel & Power Limited
These companies are among the key contributors to the steel sector in India.
Future Growth Potential

Sales Forecast – Jindal Steel and Power Limited
Based on the provided sales data for the years from March 2014 to March 2024, here is a brief analysis:
- Sales Growth Trend: Sales generally increased over the years, with some ups and downs in growth rates.
- Year-on-Year Performance: Growth was steady with notable spikes in certain years like 2019, 2022, and 2023.
- Future Outlook: Forecasted sales suggest continued growth, albeit at a more stable pace.
The company has shown overall growth, and future success will depend on adapting to market changes and seizing new opportunities.

Sales Forecast – Jindal Steel and Power Limited
Based on the provided EBITDA data for the years from March 2014 to March 2024, here is a brief analysis:
- EBITDA Growth Trend: The company’s earnings before interest, taxes, depreciation, and amortization (EBITDA) have generally gone up each year.
- Year-on-Year Performance: Most years showed higher EBITDA, especially in 2022 and 2023, though there were small drops in some years.
- Future Outlook: Predictions suggest EBITDA will keep growing steadily, showing the company might do well financially in the future.
Overall, the company’s EBITDA numbers suggest they’re doing better financially each year, with signs pointing to continued growth ahead.

Based on the provided Earning per share (EPS) data for the years from March 2014 to March 2024, here is a brief analysis:
- EPS Growth Trend: EPS has generally increased over the years, except for a slight decrease in 2017 and a dip in the projected 2024 EPS.
- Year-on-Year Performance: Significant growth was seen in EPS from 2020 onwards, indicating strong profitability improvement.
- Future Projection: The EPS is expected to continue growing steadily in the forecast years, albeit with a small decrease in 2024.
Overall, the company’s EPS has shown positive growth trends, especially in recent years, suggesting improved profitability and a generally positive outlook for future earnings per share.
Investment Recommendations
After looking at JSPL’s financial health, market trends, and how it compares to other companies, we’ve made a call on whether or not you should invest.
- Financial Health: JSPL has been improving how much profit it makes compared to its costs. It also manages its money and assets well. Returns on investments and equity have been up and down but generally positive.
- Market Trends: The stock looks good if it can stay above Rs. 1080, showing signs of a strong market. But watch out if it drops below Rs. 1000, as that could mean some risk.
- Comparison to Others: When compared to similar companies like Tata Steel and JSW Steel, JSPL holds its own. It has similar profit margins and does well managing its money and assets.
Conclusion: Based on these points, we think JSPL could be a good investment. It shows promise with its financial health and market trends compared to its competitors.
Recommendation: Consider investing in Jindal Steel and Power Limited (JSPL), but keep an eye on market changes and prices to make sure you get in at a good time and minimize risks.
This advice sums up why JSPL looks like a solid investment choice, considering its financial strength, market behavior, and how it measures up against other companies in the same industry.


